用matplotlib画图的时候,因为涉及到批量出图,固定图的大小,分别创建axes绘制主图形和colorbar,但是当图的范围不一样的时候,主图行和colorbar的间隔就会不一致,有的甚至会增大不少。
解决方法
因此就需要固定colorbar和主图行间的间隔,解决方法如下:
1
2
3
4
5
6
7
|
def colorbar(ax):
    from mpl_toolkits.axes_grid1 import make_axes_locatable

    divider = make_axes_locatable(ax)
    cax = divider.append_axes("right", size="5%", pad=0.05)

    return cax
|
 1
 2
 3
 4
 5
 6
 7
 8
 9
10
|
%matplotlib inline
import matplotlib.pyplot as plt
from mpl_toolkits.axes_grid1 import make_axes_locatable
import numpy as np

fig, ax = plt.subplots(figsize=(9, 9))
im = ax.imshow(np.arange(400).reshape((20, 20)))
cax = colorbar(ax)

fig.colorbar(im, cax=cax, ax=ax, shrink=0.8)
|
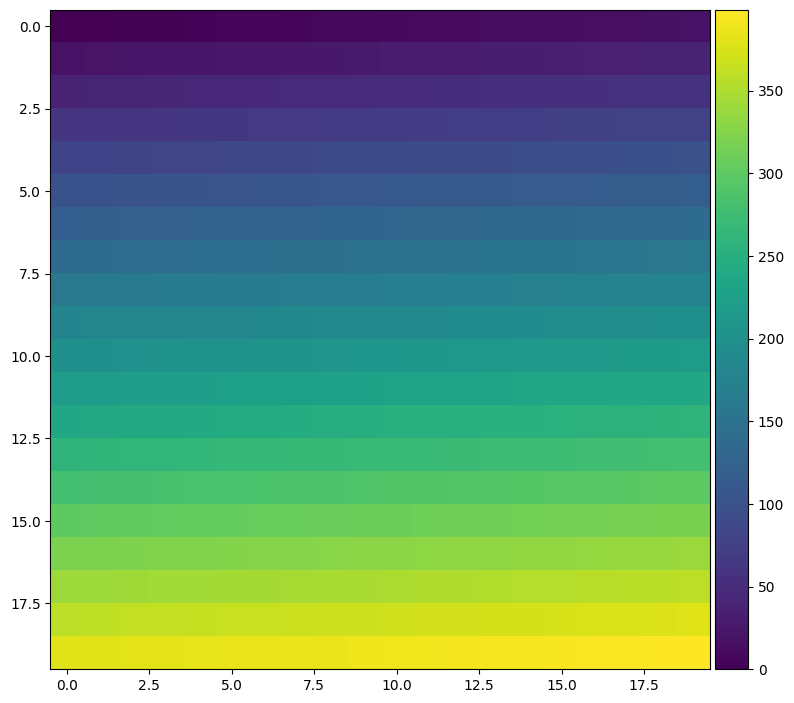
colorbar shrink无效
从上面可以看出,colorbar方法的shrink参数失效了。但是有时候又需要对colorbar进行shrink。如果直接使用上述方法可能就不行了。
下面使用make_axes_locatable固定colorbar的axes之后,获取其坐标,然后清除相应的axe,使用add_axes创建新的坐标轴即可。
 1
 2
 3
 4
 5
 6
 7
 8
 9
10
11
12
13
14
|
def adjust_colorbar(fig, ax, width=0.02, pad=0.02, shrink=1.0):
    """
    """
    from mpl_toolkits.axes_grid1 import make_axes_locatable

    divider = make_axes_locatable(ax)
    cax = divider.append_axes("right", size="5%", pad="5%")

    fig.canvas.draw()
    pos = ax.get_position()
    ydf = (1-shrink)*(pos.ymax - pos.ymin)/2
    cax.remove()

    return fig.add_axes([pos.xmax+pad, pos.ymin+ydf, width, (pos.ymax-pos.ymin)-2*ydf])
|
1
2
3
4
5
|
fig, ax = plt.subplots(figsize=(9, 9))
im = ax.imshow(np.arange(400).reshape((20, 20)))
cax = adjust_colorbar(fig, ax, width=0.03, pad=0.03, shrink=0.8)

fig.colorbar(im, cax=cax, ax=ax)
|
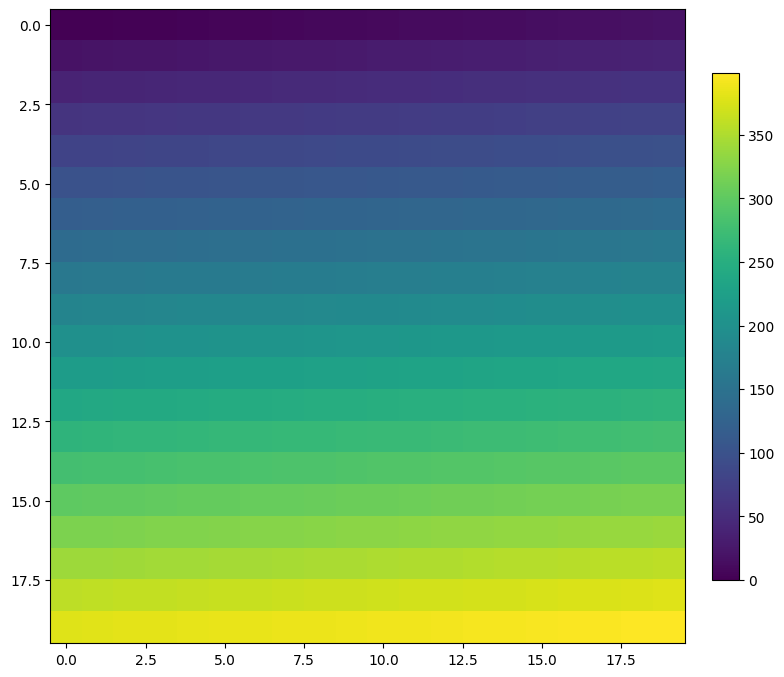
colorbar shrink
下面是使用上述函数固定colorbar前后的图对比:
左侧为固定前,右侧为固定后
使用上述函数固定后,无论坐标轴的范围如何变化,主图行和colorbar间的间距都是固定的,都不会发生变化。
参考链接:
- https://joseph-long.com/writing/colorbars/